Climate and Weather Charts
Sydney Airport (SYD)
(Sydney, New South Wales - NSW, Australia)

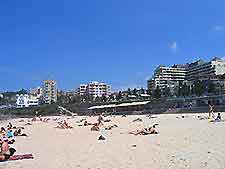
Sydney features a subtropical climate with a long summer season, which tends to fall between November to March. Located in the southern hemisphere, the summer months in Sydney are a particularly popular time to visit the city, when its beaches and coastline are amongst the highlights.
Winters in Sydney, between June to August, are extremely mild and warm, although this time of the year can be a little damp. Springtime in the city, around September and October, is an appealing time of the year, when many of the area's plants begin to flower. Sydney differs to much of Australia, with a fairly stable climate with few extremes. Many people choose to visit the city during December, to enjoy the fine Sydney weather and celebrate Christmas on the city's beaches. The average annual daytime temperatures in Sydney are around 23°C / 74°F.
Climate Description: Subtropical climate
Sydney Airport (SYD) Location: Southern Hemisphere, Australia, New South Wales
Annual High / Low Daytime Temperatures at Sydney: 30°C / 16°C (86°F / 61°F)
Average Daily January Temperature: 30°C / 86°F
Average Daily June Temperature: 17°C / 63°F
Annual Rainfall / Precipication Sydney at Airport (SYD): 1226 mm / 48 inches
Sydney Airport (SYD):
Climate and Weather Charts
Temperature Chart |
| Temperatures |
Jan |
Feb |
Mar |
Apr |
May |
Jun |
Jul |
Aug |
Sep |
Oct |
Nov |
Dec |
Average |
Maximum
Celcius (°C) |
30 |
30 |
26 |
23 |
20 |
17 |
16 |
17 |
20 |
22 |
26 |
29 |
23 |
Minimum
Celcius (°C) |
21 |
20 |
18 |
16 |
12 |
9 |
8 |
9 |
11 |
13 |
16 |
20 |
14 |
Maximum
Fahrenheit (°F) |
86 |
86 |
79 |
73 |
68 |
63 |
61 |
63 |
68 |
72 |
79 |
84 |
74 |
Minimum
Fahrenheit (°F) |
70 |
68 |
64 |
61 |
54 |
48 |
46 |
48 |
52 |
55 |
61 |
68 |
58 |
Rainfall / Precipitation Chart |
| Rainfall |
Jan |
Feb |
Mar |
Apr |
May |
Jun |
Jul |
Aug |
Sep |
Oct |
Nov |
Dec |
Total |
| Rainfall (mm) |
104 |
112 |
132 |
130 |
122 |
130 |
102 |
81 |
69 |
84 |
81 |
79 |
1226 |
| Rainfall (inches) |
4.1 |
4.4 |
5.2 |
5.1 |
4.8 |
5.1 |
4.0 |
3.2 |
2.7 |
3.3 |
3.2 |
3.1 |
48 |
| Sydney Days of Rain |
5 |
5 |
6 |
4 |
6 |
5 |
4 |
3 |
3 |
5 |
6 |
3 |
55 |
Seasonal Chart |
| Seasons |
Average
Temp
(Max °C) |
Average
Temp
(Min °C) |
Average
Temp
(Max °F) |
Average
Temp
(Min °F) |
Total
Rainfall
(mm) |
Total
Rainfall
(inches) |
| Mar to May (Autumn / Fall) |
23 |
15 |
73 |
60 |
384 |
15 |
| Jun to Aug (Winter) |
17 |
9 |
62 |
47 |
313 |
12 |
| Sept to Nov (Spring) |
23 |
13 |
73 |
56 |
234 |
9 |
| Dec to Feb (Summer) |
30 |
20 |
85 |
69 |
295 |
12 |
 Sydney features a subtropical climate with a long summer season, which tends to fall between November to March. Located in the southern hemisphere, the summer months in Sydney are a particularly popular time to visit the city, when its beaches and coastline are amongst the highlights.